
Independent ocean-freight performance analysis
Supply Chain Shipping Line & Lane Analysis
Understand how your ocean-freight routes, carriers and transshipment services perform in practice. Strategic Tracking turns fragmented shipment milestones and visibility data into evidence for routing, procurement, planning and operational improvement.
- Independent, requirements-led analysis
- Planned-versus-actual milestone comparison
- Carrier, forwarder and visibility-data assessment
- Practical findings for operations and procurement
Analysis quality depends on the coverage, consistency and comparability of the available shipment data. Gaps and limitations are documented rather than concealed.
Journey stages under analysis
Where elapsed time and variability accumulate
- 01
Origin
Cargo ready - Booking confirmed - Empty release / collection, where relevant - Gate-in
- 02
Ocean and transshipment
Estimated and actual arrival at intermediate port - Discharge - Transshipment dwell - Loaded on connecting vessel
- 03
Destination
Vessel arrival - Container discharge - Cargo or container availability - Customs / release milestone, where supplied
Milestone availability differs by shipment, provider and port. The analysis states which stages are evidenced and which are not.
Reported transit time is not the whole journey
Find Out Where Time and Visibility Are Really Being Lost
A quoted or scheduled transit time rarely describes every stage from cargo readiness to final receipt. Bookings may be rolled, departure dates revised, containers may wait at transshipment ports, and destination availability can occur well after vessel arrival. Different systems may also label the same operational event in different ways.
Strategic Tracking establishes a common milestone model, reconciles the available sources and compares like-for-like movements. The result is a clearer view of variability, dwell, exceptions and data quality, not merely another average transit-time report.
Schedule variance
Compare planned, booked, estimated and actual departure and arrival milestones.
Origin delay
Separate cargo-readiness, gate-in, cut-off, loading and departure stages where the data permits.
Transshipment exposure
Identify extended dwell, missed connections and variability introduced by indirect services.
Destination dwell
Examine discharge, availability, customs, collection and final-delivery timing as distinct events.
Provider performance
Compare carriers, forwarders, services or routing options using agreed populations and definitions.
Visibility gaps
Reveal late, missing, contradictory or low-value events that hinder operational response.
What can be analysed
Analysis Built Around the Decisions You Need to Make
The precise analysis should follow the commercial or operational decision, not the data feed that happens to be easiest to obtain.
Lane design
Which origin-destination and port combinations are most consistent?
Possible output
Lane comparison and variability profile
Carrier or forwarder review
How do providers perform for comparable cargo, periods and routings?
Possible output
Normalised provider scorecard
Direct vs transshipment
Does lower cost introduce more dwell, hand-offs or missed connections?
Possible output
Routing trade-off analysis
Inventory planning
Are planning lead times and buffers aligned with demonstrated distributions?
Possible output
Parameter and buffer recommendations
SLA management
Which milestones are defined, measurable and supported by usable evidence?
Possible output
SLA evidence pack and definition review
Exception management
Which events arrive early enough for someone to act?
Possible output
Alert and escalation opportunity map
Tender support
What evidence should inform routing and service requirements?
Possible output
Procurement findings and data requirements
Visibility investment
Would additional carrier, platform or tracker data close a material gap?
Possible output
Data-source and integration recommendation
Provider comparisons must control for relevant differences such as lane, season, cargo type, service level, routing and shipment population. A league table without a comparable denominator can be misleading.
The shipment milestone model
Measure the Journey Stage by Stage
- 01
Origin
- Cargo ready
- Booking confirmed
- Empty release / collection, where relevant
- Gate-in
- Cut-off
- Loaded on vessel
- Actual departure
- 02
Ocean and transshipment
- Estimated and actual arrival at intermediate port
- Discharge
- Transshipment dwell
- Loaded on connecting vessel
- Connection departure
- Revised ETA history, where available
- 03
Destination
- Vessel arrival
- Container discharge
- Cargo or container availability
- Customs / release milestone, where supplied
- Collection / gate-out
- Final delivery or plant receipt
Not every shipment or data provider exposes every milestone. Before analysis, Strategic Tracking creates a data dictionary that defines the event, timestamp, time zone, source and confidence or completeness rule. Where two systems use different meanings, those events are not silently treated as equivalent.
Data sources and what each can prove
Reconcile Multiple Sources Without Treating Them as Interchangeable
Booking and schedule data
Useful for
Intended service, ports, planned ETD/ETA and routing
Important limitation
Plans and estimates can change
Carrier or forwarder milestones
Useful for
Operational container and documentation events
Important limitation
Definitions, latency and completeness vary
Port and terminal events
Useful for
Gate, load, discharge and availability evidence where accessible
Important limitation
Coverage and access vary by port and system
Vessel AIS data
Useful for
Vessel identity, reported movement and port-call context
Important limitation
Tracks the vessel, not proof of a particular container's position; coverage and data quality have limits
Independent container or cargo tracker
Useful for
Device-observed location and sometimes condition data
Important limitation
Reporting depends on configuration, placement, power and connectivity; enclosed or maritime environments can delay transmissions
TMS, ERP, WMS or control-tower data
Useful for
Orders, bookings, receipts, plans and business context
Important limitation
Internal timestamps may reflect system entry rather than the physical event
Manual or partner records
Useful for
Context for exceptions and root-cause investigation
Important limitation
May be incomplete, inconsistent or subjective
Vessel location is not automatically container location. A container must first be associated with the correct booking, equipment and vessel leg, and a vessel-position feed cannot confirm that the container was actually loaded or remains aboard without corroborating events.
"Real time" should describe the availability and latency of a defined event or reading. It must not be used as shorthand for continuous, complete or error-free visibility.
Analysis method
A Structured Route from Raw Events to Defensible Findings
- 01
Define the decision and population
Agree the business question, lanes, shipment types, analysis period, providers, service levels and exclusions.
- 02
Establish the milestone dictionary
Define planned, booked, estimated and actual events; standardise time zones; document ownership and source.
- 03
Inventory and assess the data
Review files, APIs, carrier feeds, internal systems and device data for coverage, latency, consistency and identifiers.
- 04
Resolve shipment identities
Map orders, bookings, bills of lading, container numbers, voyage legs, devices and receipt records without relying on unsafe assumptions.
- 05
Clean, reconcile and calculate
Handle duplicate, revised, missing and out-of-sequence events; calculate elapsed time, dwell, variance and distributions using agreed rules.
- 06
Compare and investigate
Segment results by lane, carrier, service, port, transshipment pattern, period and other relevant factors. Review material exceptions for context.
- 07
Recommend and operationalise
Translate findings into routing, procurement, SLA, planning, alerting, data-quality or integration actions, with owners and measurement criteria.
The engagement should preserve a clear line from source event to calculation to finding. Assumptions, exclusions and data-quality limitations are included in the final output.
Performance measures
Useful Measures Go Beyond a Single Average
- Schedule departure variance
- Arrival variance and ETA revision history
- End-to-end elapsed time
- Median and percentile transit performance
- Variability by lane, service and provider
- Origin, transshipment and destination dwell
- Rolled or missed-connection incidence, if reliably identifiable
- Milestone completeness and timeliness
- Exception-detection lead time
- Time from exception to acknowledgement or action, if workflow data exists
- SLA attainment against a precisely defined measure
- Data-source agreement and contradiction rate
Averages can hide the tail that causes stockouts, production disruption or missed customer windows. Use medians, percentiles, ranges, distributions and sample sizes where they better represent operational risk.
Illustrative analysis structure - not client data
The structure below shows how results are organised in a report. No figures are published here because every engagement measures a different shipment population.
Lane segment
Median and 90th-percentile elapsed time
Provider segment
Departure and arrival variance distribution
Journey stage
Origin, transshipment and destination dwell
Data quality
Milestone completeness, latency and contradictions
Deliverables
What You Can Receive
Data and milestone assessment
A documented view of data sources, identifiers, event definitions, coverage, latency and limitations.
Lane and provider scorecard
Comparable performance results segmented according to the agreed analysis population and methodology.
Delay and dwell analysis
Evidence showing where elapsed time and variability accumulate across the shipment journey.
Findings and recommendations report
Prioritised operational, procurement, routing, planning and visibility recommendations, with assumptions and evidence boundaries.
Management workshop
A working session for supply chain, logistics, procurement, planning and technology stakeholders to agree actions and ownership.
Optional extensions
- Recurring performance reporting
- Tender or SLA measurement support
- Independent tracker pilot
- API and data-integration design
- Exception workflow and dashboard specification
Not every engagement includes all deliverables. Final scope is agreed according to objectives and data readiness.
Engagement options
Choose the Right Starting Point
Data-readiness review
For organisations that need to establish whether existing sources can answer the business question before commissioning deeper analysis.
Indicative outputs
- Source inventory
- Milestone dictionary
- Gap assessment
- Recommended next phase
Focused lane analysis
For a defined route, provider population, product group or operational concern.
Indicative outputs
- Cleaned dataset
- Performance analysis
- Findings
- Review workshop
Multi-lane or provider benchmark
For procurement, network design, service review or planning across a broader shipment population.
Indicative outputs
- Normalised scorecards
- Segmented comparisons
- Variability analysis
- Recommendations
Ongoing performance framework
For organisations that want repeatable measurement, data-quality monitoring and integration with operational workflows.
Indicative outputs
- Metric definitions
- Reporting model
- Governance
- Integration requirements
- Review cadence
Who this service is for
Built for Teams Making Ocean-Freight Decisions
- Supply-chain and logistics directors
- Ocean-freight and transport managers
- Procurement and contract-management teams
- Control-tower and visibility teams
- Inventory and production planners
- Data, BI and integration teams
- Manufacturers and importers using repeat international lanes
- Businesses reviewing forwarder, carrier or port-routing performance
The service is most valuable where there is a recurring shipment population, a material operational decision and enough source data to test the question. A limited diagnostic can be used where readiness is uncertain.
What Strategic Tracking needs
Helpful Inputs for an Initial Discussion
- The business question or decision to be supported
- Origin, destination and port pairs
- Shipping lines, forwarders and service types in scope
- Approximate shipment count and date range
- FCL, LCL or other shipment characteristics
- Available booking, bill-of-lading and container identifiers
- Planned, estimated and actual milestone data
- TMS, ERP, WMS, spreadsheet or carrier-platform sources
- Existing SLA definitions and planning parameters
- Known problem lanes, ports or transshipment points
- Any independent tracker or sensor data
- Security, privacy, retention and access constraints
Please do not send commercially sensitive shipment files through a public web form. The initial enquiry should cover high-level scope only; a suitable controlled transfer route can be agreed after contact.
Independent specialist
Independent Analysis, Focused on Your Decision

Strategic Tracking is an independent tracking-technology and supply-chain visibility consultancy. The analysis is designed around the customer's operational question and may combine carrier, platform, internal-system and independent tracking data where appropriate.
Recommendations are not limited to a single carrier, device or software platform. Where the evidence is incomplete, that limitation is made visible rather than converted into false certainty.
Organisations Matthew has supported or worked with


Logos indicate organisations Matthew has supported or worked with. They do not imply that each engagement involved shipping-line analysis, or any endorsement by shipping lines whose data or terminology is discussed on this page.
Related services
From Analysis to Better Visibility and Action
Visibility Consultancy & Use-Case Evaluation
Frame the operational problem, business case, technology options and pilot.
Visibility Platform Integration Services
Connect and normalise carrier, tracking and enterprise-system data for production use.
Tracking Device Quick Quote
Request suitable device and supplier options when the requirement is primarily product sourcing.
Questions
Shipping Line and Lane Analysis: Frequently Asked Questions
What is shipping line and lane analysis?
Can you compare different shipping lines or freight forwarders?
What data is required?
Is vessel AIS data the same as container tracking?
Can the analysis verify an SLA breach?
Can you analyse door-to-door shipments?
Can you help improve ETA and exception visibility after the analysis?
How many shipments are needed?
Do you sell freight or act as a shipping line?
Will the analysis guarantee lower costs or faster delivery?
Next step
Turn Shipment Milestones Into Better Ocean-Freight Decisions
Tell us which lanes, providers or performance questions you need to investigate. We will help define a proportionate first stage based on the decision, shipment population and available data.
Outline Your Analysis Requirement
The enquiry form collects high-level scope only:
- First name
- Last name
- Business email
- Company
- Role
- Telephone (optional)
- Primary analysis objective
- Main origins and destinations
- Approximate shipments in scope
- Data sources currently available
- Brief description
Your information will be used to assess and respond to this enquiry. Please do not include confidential shipment data in this form.

Tracking Tuesday: When Shipment Visibility Becomes a Cyber Risk
Satellite connectivity extends shipment visibility — and its cyber-risk surface. Seven questions buyers should ask about secure, resilient tracking.
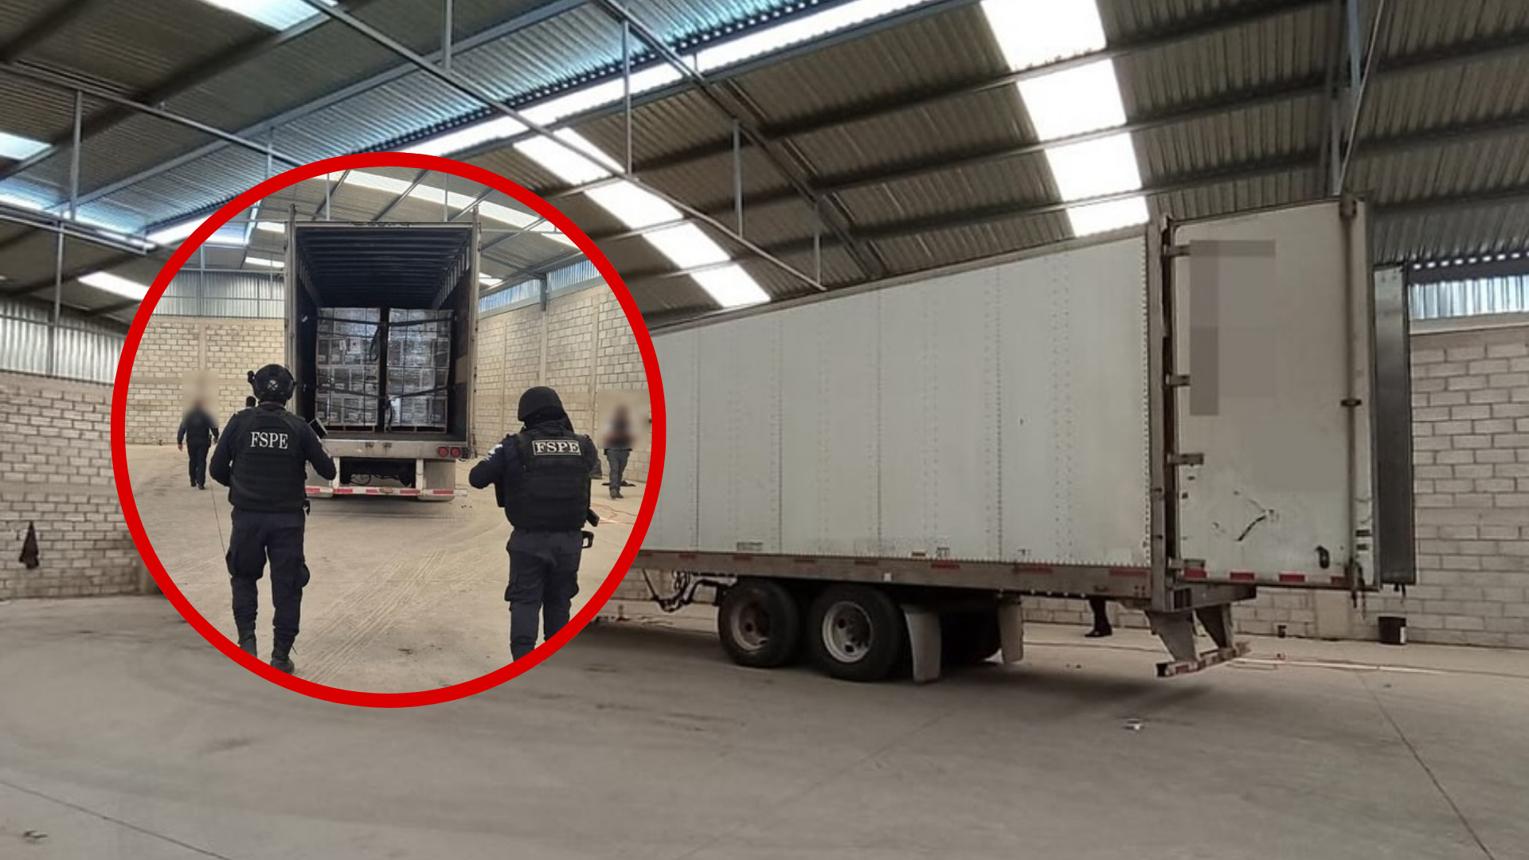
70,000 Pints Stolen: Tracking High-Risk Drinks Cargo
Drinks are a major global cargo-theft target. Discover how independent cargo tracking, smart labels, geofences and layered visibility can reduce risk.
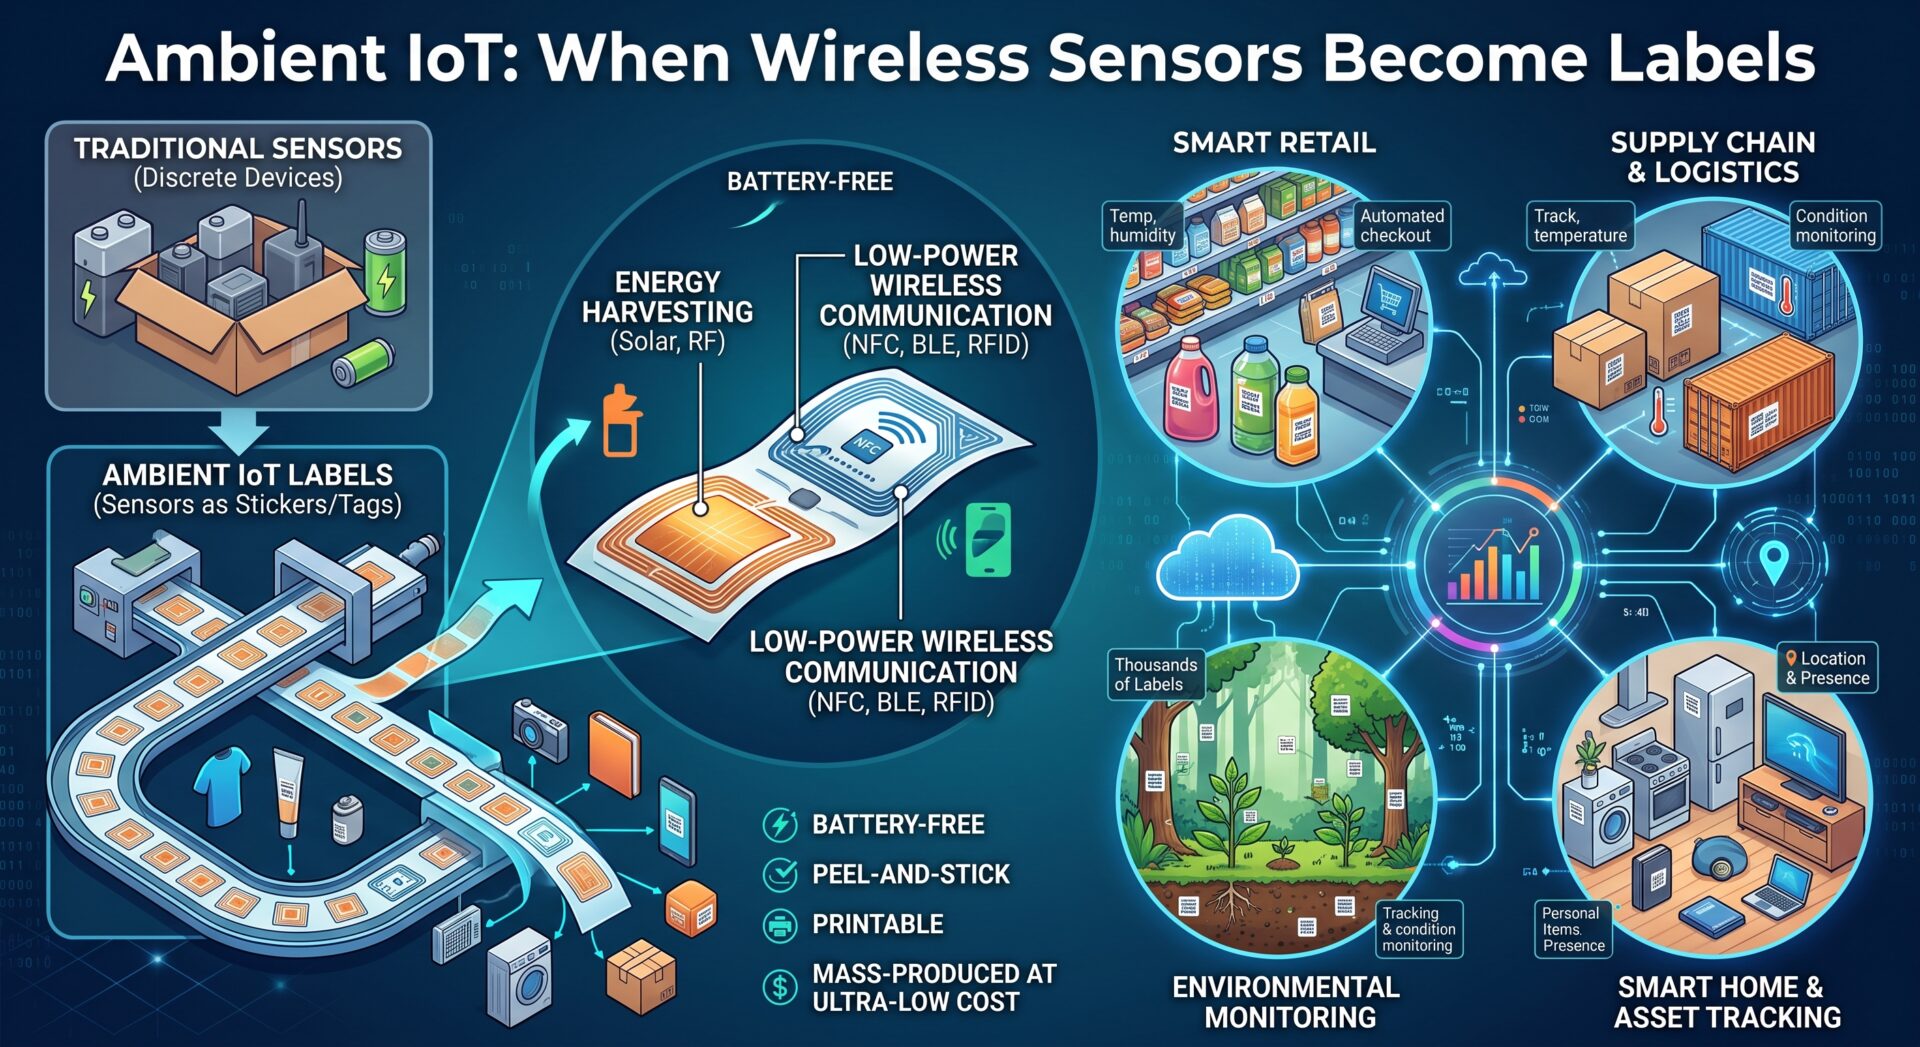
Tracking Tuesday: Ambient IoT: When Wireless Sensors Become Labels
Wiliot and CISC can test battery-free IoT Pixels at high volume. Discover why manufacturing economics may unlock ambient IoT supply chains.

Satellite-Enabled Bluetooth Is Impressive—but Industrial Asset Tracking Needs More Than Connectivity
Hubble Network is extending Bluetooth signals to satellites, but industrial asset tracking requires more than a radio link. Explore the practical advantages of Sensolus for reusable, non-powered assets.